
How the Data AI Agent Factory turns scattered marketing exports into decisions
Open the exports from three ad platforms and look at the column for money spent. Meta calls it "Amount spent". Google Ads calls it "Cost". LinkedIn calls it "Total spent". Revenue is just as inconsistent, and the dates come in different formats.
Before anyone can answer a simple question, such as which channel is getting more expensive, someone has to rename columns, fix number formats and stitch the files together in a spreadsheet. Every week. By the time the numbers line up, the meeting has started.
The Data AI Agent Factory (DAAF) is built to remove that step, and the one after it: working out what the numbers mean.
Step 1: one structure for every source
DAAF takes the exports you already have and maps them into one consistent structure.
Familiar columns are recognised automatically. "Amount spent", "cost" and "media cost" all become spend. "Purchase conversion value" and "conversion value" become revenue. The same goes for dates, channels, campaigns, clicks, leads, conversions and more.
Messy formats are cleaned. A value like "USD 1,200.50" becomes the number 1200.5, so totals add up correctly.
Unfamiliar columns get an AI suggestion, with a safety margin. When a column name isn't recognised, an AI mapper suggests what it probably means and how confident it is. If it isn't confident enough, it leaves the column unmapped rather than guessing. A wrong mapping is worse than a missing one, because it quietly corrupts every number built on it.
Your rows don't leave your browser for the mapping. Only column names and data types are sent to the AI mapper. In the demo, uploaded rows stay in your browser session.
Step 2: one view of performance
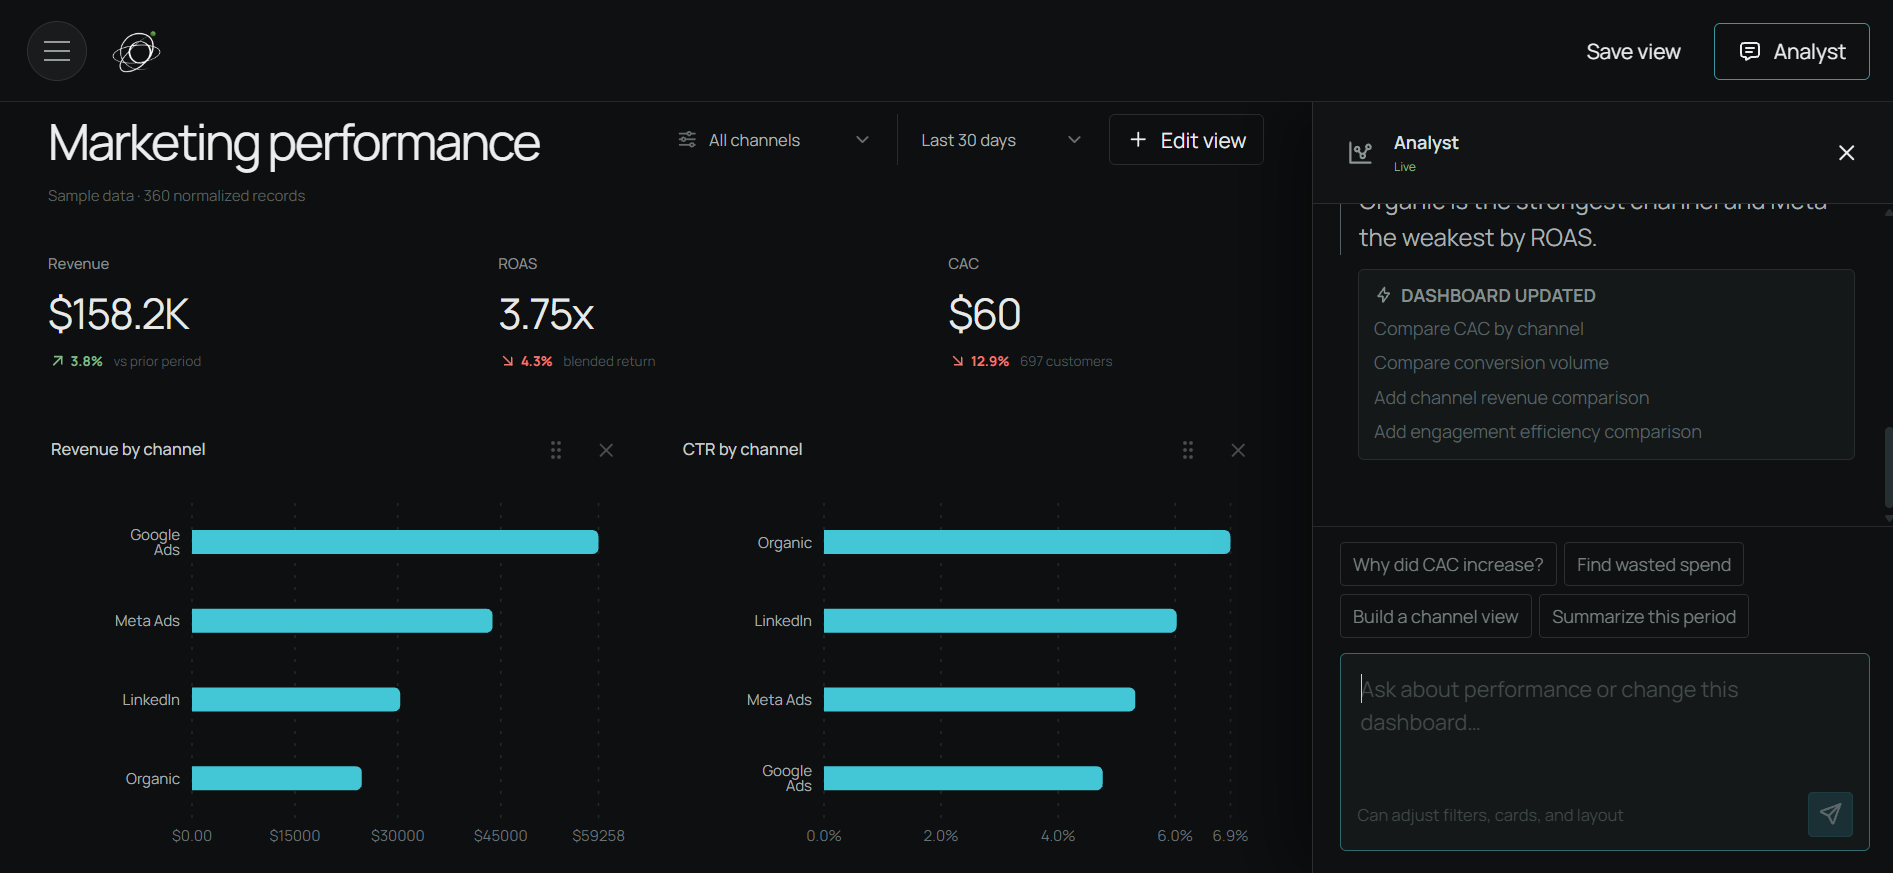
Once the data shares one structure, the dashboard shows what matters commercially in one place:
- revenue and marketing spend over time
- return on ad spend (ROAS) and customer acquisition cost (CAC)
- cost per click, click-through rate, leads and conversions
- channel-by-channel comparisons and a campaign watchlist
- a funnel built only from the stages your data actually contains
That last point is deliberate. If your data has sessions, leads and conversions, the funnel shows those three. It doesn't invent a "qualified" stage your data can't support.
You can filter by channel and by the last 30, 60 or 90 days, drag and resize the charts, and save the view so it's there next time.
Step 3: an analyst you can question
Next to the dashboard sits an AI analyst. You ask questions in plain language, and it answers from the data on screen.
| You ask | What the analyst does |
|---|---|
| "Why did CAC increase?" | Names the channel with the highest acquisition cost, adds a channel efficiency chart, and suggests checking conversion quality before cutting spend |
| "Find wasted spend" | Compares the least efficient channel with the best one, and adds a campaign watchlist so you can review the gap campaign by campaign |
| "Summarise this period" | Gives a short, decision-focused summary of what changed |
| "Show me CAC by channel for the last 90 days" | Changes the dashboard for you: adds the chart and sets the filter |
The analyst works under strict rules:
- It analyses only the metrics it's given, and never invents missing data.
- It doesn't present a correlation as a cause. If two things moved together, it says so, and says that it doesn't prove one caused the other.
- It's explicit about uncertainty, and it prefers explaining to changing things.
- When it does change the dashboard, it makes at most four changes per request, and only adds charts your data can actually fill.
- It receives aggregated metrics, not your raw rows.
The goal is an analyst that's useful because it's careful. A confident wrong answer about your budget is worse than an honest "the data doesn't show that".
What it doesn't do (yet)
Today, DAAF works from CSV exports. Live scheduled syncing from ad platforms is the next layer, and it needs proper authorisation: Google Ads requires OAuth access and a developer token, and Meta requires an app with the right ads permissions. We'd rather say that plainly than imply a connection that isn't there.
It also doesn't settle which channel "really" caused a sale. Each platform counts conversions by its own rules, and no dashboard removes that on its own. DAAF gives you one consistent view and an analyst that explains changes. Deciding what to do about them stays with your team.
Who it's for
DAAF fits founders and marketing teams spending across several channels who are tired of rebuilding the same report every week, and who want answers to "what changed and why" without waiting for an analyst's free afternoon.
Try the demo
The Data AI Agent Factory page has a guided demo with sample data: a dashboard, the analyst and the controls in three short steps. Ask it to rebuild the dashboard and watch it happen.
If you'd like to see your own numbers in it, request a free audit. We'll start where every useful analysis starts: agreeing what your metrics mean and where the true numbers live.